Example 1.1 Creating a diagram
The following diagram can be created easily by using connector
(Connector) and auto align.
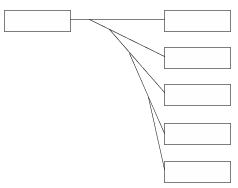
Step1 Creates the text boxes.
Create the text boxes representing methods and input them texts.
|
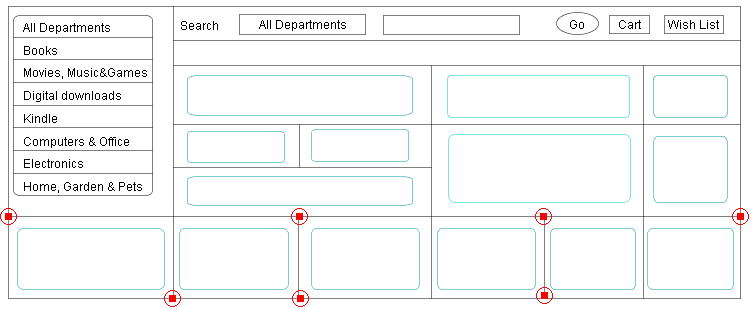
Step2 Arranges the text boxes roughly.
Arrange the text boxes using auto align function.
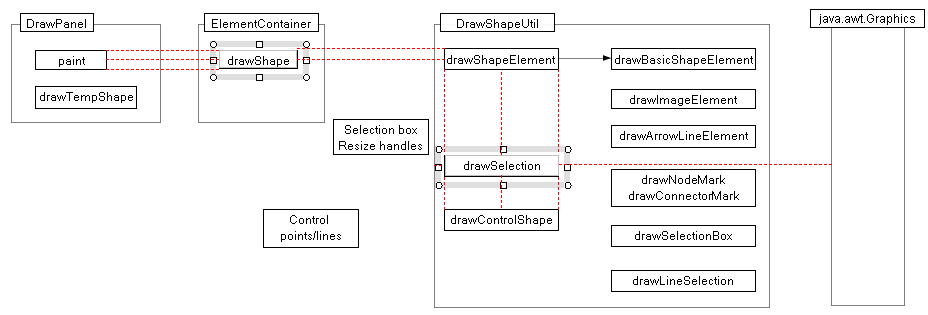
The red dotted lines shows that the selected shape being moved
aligns with neighboring shape objects within a given error margin.
|
Step3 Creates connectors.
Create lines and polylines to connect two text boxes. If the mouse is on
a characteristic point / a boundary of a shape, then the
 / / mark will be displayed as the figure below. Besides a line or polyline
can be connected with other shape by dragging its endpoint toward the boundary
of the other shape and releasing the mouse button (Connector).
mark will be displayed as the figure below. Besides a line or polyline
can be connected with other shape by dragging its endpoint toward the boundary
of the other shape and releasing the mouse button (Connector).
 : Horizontal or vertical line (connector) : Horizontal or vertical line (connector)
To create a horizontal/vertical line or line segment of a polyline, drag
the mouse with holding down Shift/Ctrl key (Creating a line/polyline). Or to change a inclined line to a horizontal/vertical line, drag the
endpoint of the line (resize the line) with holding down Shift/Ctrl key
(Move the endpoint of a line/
polyline).
:
,
marks =>
Connection point mark
In the normal operation, this type of the mark will be erased from the
screen before the next mark is displayed. In the below, the marks were
not erased for easy comprehension.
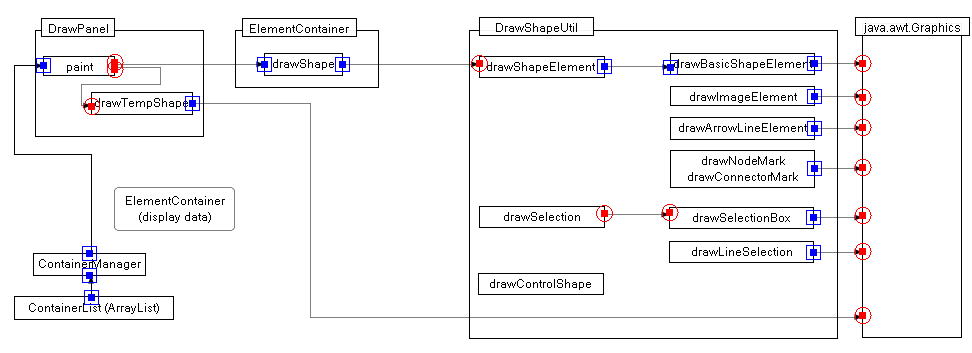
Figure_(a)
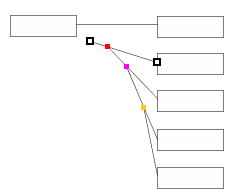
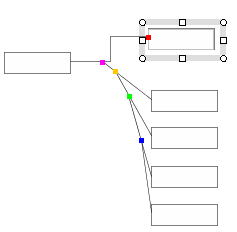
A connector ( a line or a polyline) can be connected with other connector.
The Figure_(b) shows the scene that connectors are connected with other connectors (the red marks).
Figure_(b)
|
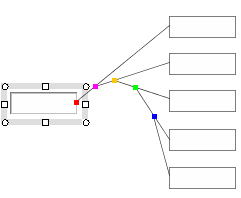
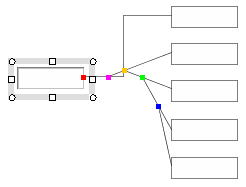
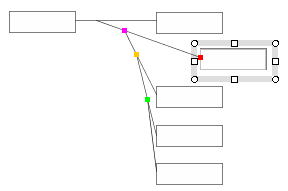
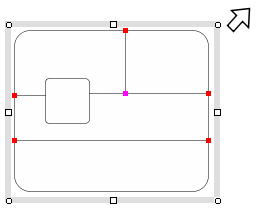
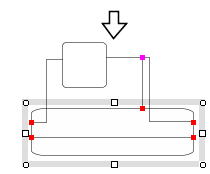
Step4 Changes the layout.
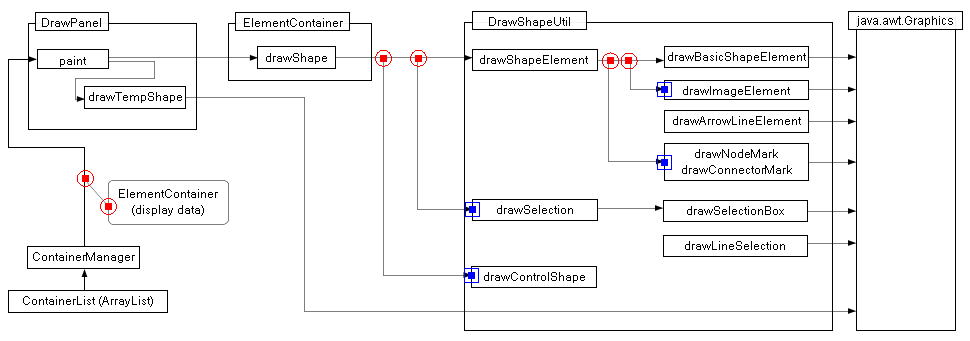
The Figure_(c) shows that the two sub blocks at the left side are
moved rightward. The small color marks represent the connection points
and their colors represents the depths from the selected shape in graph (tree structure).
Finally, execute small modifications, then we get the Figure(d).
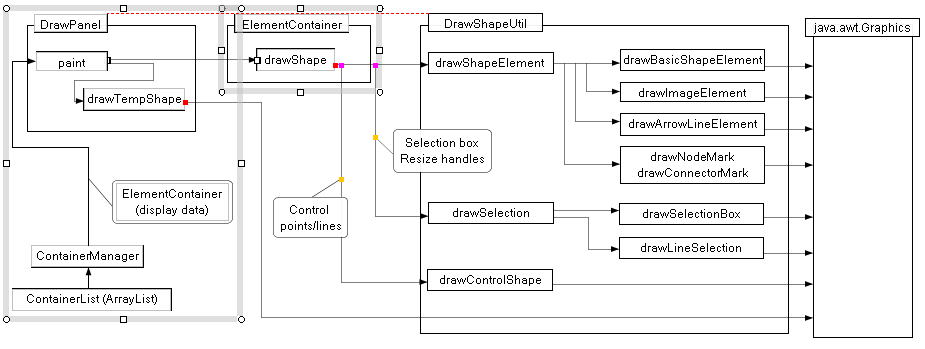

Figure_(c)
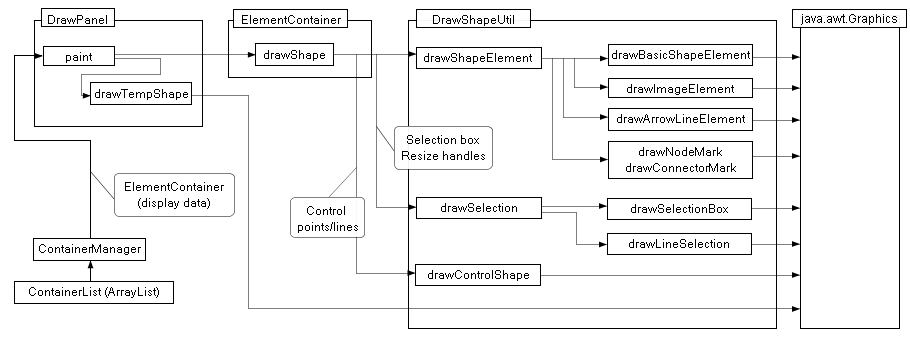
Figure (d)
|
Example 1.2 Creating a table return=> page top
he following table can be created easily by using connector (Connector).
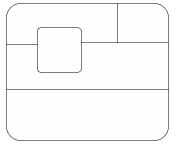
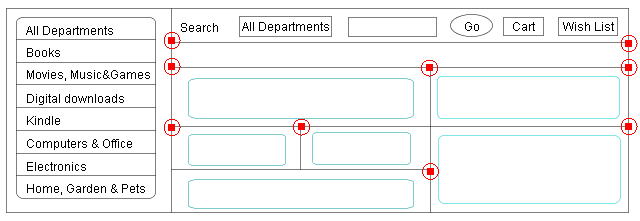
Step1 Creates a table.
Creates a table by drawing horizontal and vertical lines inside a rectangle. To
create a horizontal or vertical line, drag the mouse with holding down
the Shift/Ctrl key.
:
marks =>
Connection point mark
|
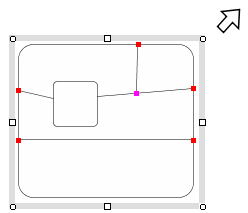
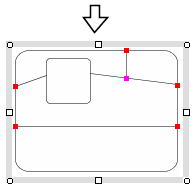
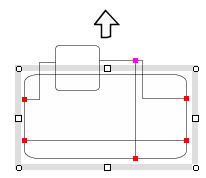
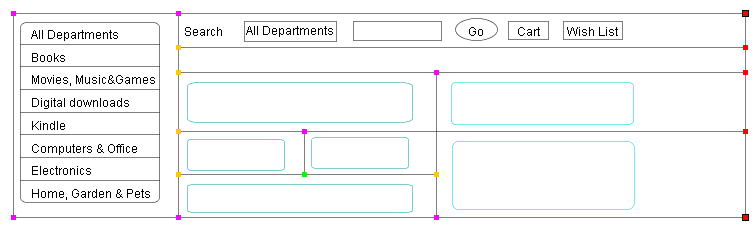
Step2 Extends the table rightward.
Moves the right side line rightward by the mouse dragging with holding
down Shift/Ctrl key. Here the small color marks represent the
connection points and those connections are preserved by moving the endpoints
of the connectors (lines).
|
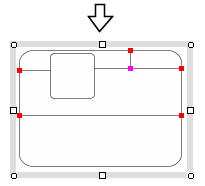
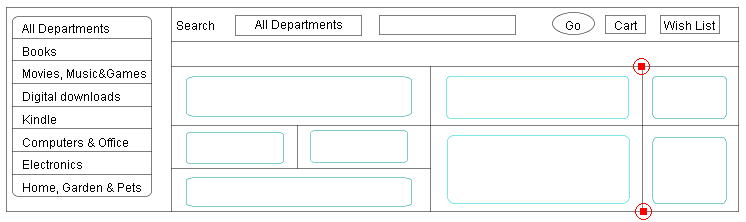
Step3 Adds lines.
Adds horizontal and vertical lines to the extended table and rearrange
the components in the top row.
|
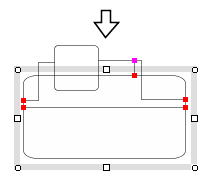
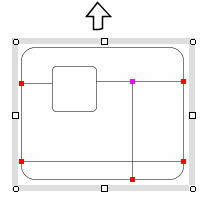
Step4 Extends the table downward and adds lines
Moves the bottom line downward to extend the table and adds new lines.
|
Example 1.3 Connector demonstration.
return=>page top
|
 Home
Home
 =>
=>